Cost optimization for complex products or systems is a challenge many industrial companies still struggle to solve. When every component is custom-made and reliable benchmarks are lacking, traditional methods often fall short. This article introduces a new framework that helps to regain cost clarity.
The Challenge: Complexity, Customization, and Cost Explosion
Let’s start with a reality check: complexity is the standard in many complex industries like aerospace, defense, and energy. Products are custom-made, tolerances are tight, and interdependencies run deep. As a result, cost structures have exploded. Functional demands and outsourcing have driven procurement costs to exceed 60% of total COGS1.
In addition, procurement often resembles a black box. Teams face challenges such as incomplete data and custom parts. Sometimes, even a basic bolt can cost 5,000 €, and often, not even the suppliers can explain why.
How often have you heard: “There’s nothing to optimize here anymore. This component is just that special.”
At Avencore, we believe that even custom and specialized products and components can be optimized. The Avencore Cost Optimization Potential Matrix (ACOP Matrix) is one of the several tools we use, particularly when data is limited or benchmarks are hard to establish.
In such cases the ACOP Matrix helps us challenge costs with a reasonable effort and quickly identify where to look deeper. This way we help teams gain clarity where it is usually lacking by making cost decisions more transparent.
Why Most Cost Analyses Don’t Work in Complex Systems
Traditional procurement benchmarking relies on large datasets, comparable parts, and repeatability. However, this approach is not effective in complex product system industries. Usually, there are three problems procurement teams face:
- Material cost transparency: Companies often struggle to understand how costs are distributed within complex, custom-engineered parts.
- Comparative market value transparency: Even when they do, there’s rarely a viable benchmark to compare against since every product and component is uniquely specified.
- Cost structure transparency: Supplier cost breakdowns are often absent or opaque. Prices are presented whole, without logic or proof.
Take the aerospace industry as an example: every part is designed to specification, produced in low volume, and assembled into highly integrated systems. Cost drivers hide behind complexity, and without clear benchmarks, procurement teams are left to negotiate in the dark.
This results in inflated prices that are justified by suppliers’ experience. Buyers must either overpay or request design changes without understanding the cost implications.
This is where our framework comes into play. Developed with leading industry experts and academic researchers, the Avencore Cost Optimization Potential Matrix (ACOP Matrix) gives procurement teams the clarity to act where it matters most.
What the ACOP Matrix Does Differently
To overcome the transparency trap, the ACOP Matrix shifts the focus from asking what something costs to why it costs that much. This new kind of thinking can lead to better and more grounded decisions.
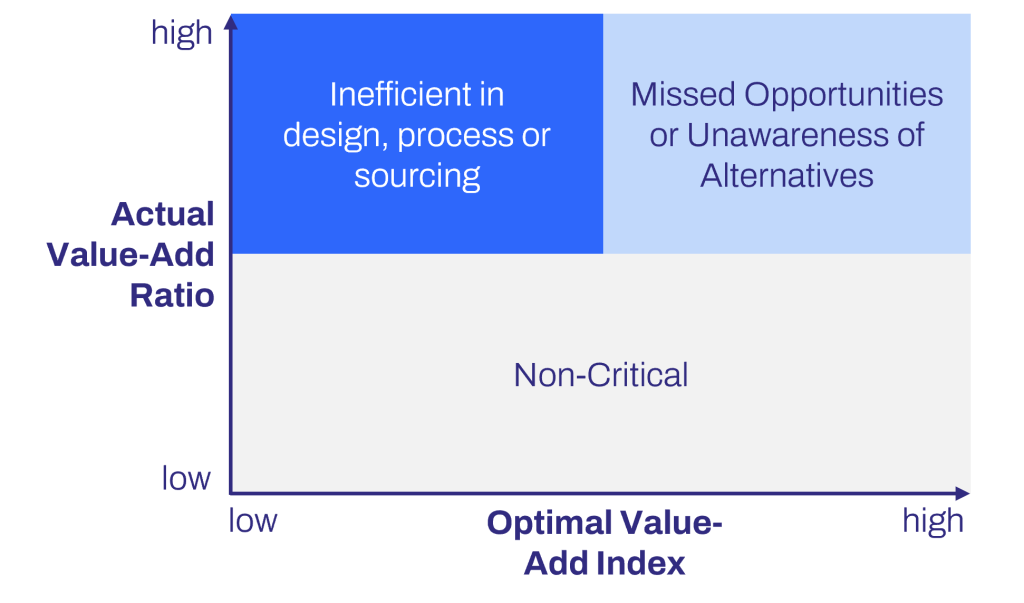
The framework is built around two metrics that define the axes of the matrix:
- Actual Value-Add Ratio (Y-axis): How much of the total cost stems from processing beyond raw material?
This metric tells us how much of the total cost is actually adjustable, meaning it can be influenced or optimized. If a part has hardly any cost beyond its raw material, then the potential for cost reduction is limited to adjustments to the material.
- Optimal Value-Add Index (X-axis): How much of the added cost is justified by functional complexity?
This metric measures whether the component’s complexity is in relation to the added costs.
These two values together form a 2×2 logic that reveals hidden cost optimization potential at the component level. Furthermore, it helps to identify components in need of improvement.
The ACOP Matrix distinguishes three actionable categories:
- Non-critical: Parts with low added cost and low complexity can remain as they are.
- Inefficient in design, process, or sourcing: Parts with high added cost and low complexity should be challenged and optimized.
- Missed opportunities or unawareness of alternatives: Parts with high added costs and high complexity, which may benefit from redesign or smarter sourcing strategies.
How We Measure What Can Be Optimized
The Actual Value-Add Ratio (AVR) shows how adjustable the cost is. If 95% of a component’s cost is attributed to something other than raw materials, it signals that there’s room to optimize through design, sourcing, or process changes.
Therefore, it should be the starting point for most cost discussions, but it rarely is. Rather than focusing on whether a price “feels right”, the AVR asks a more grounded question: How much of this price represents true value beyond raw material?
Here’s how we calculate it:
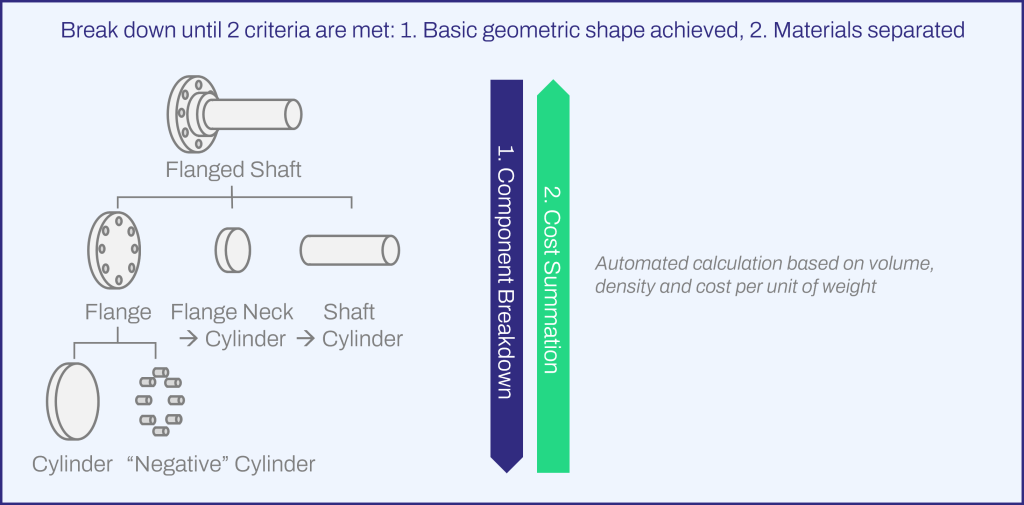
- Raw Material Cost Estimation via Generative Breakdown
We use the generative method to break down each component until two things are achieved: The basic geometric shape is reached, and all materials are separated.
This approach mirrors how raw materials are procured and ensures that no structural or compositional detail is overlooked. - Automated Tool-Based Calculation
Using this granular breakdown, we input the data into our in-house pricing tool, which automatically calculates raw material costs based on current €/kg rates. This creates a solid, scalable baseline grounded in real data. - Ratio Formation
We calculate a ratio that compares the added cost to the baseline cost of the raw material. This provides a clear view of how much of the cost is adjustable and subject to decisions regarding design, sourcing, or manufacturing.
The AVR enables relative comparisons between components, but absolute values still matter. For instance, a 100,000 € part with an AVR of 2 offers far greater savings potential than a 1,000 € part with an AVR of 5.
How We Decide Which Added Costs Make Sense
While the AVR considers how much value is added, the Optimal Value-Add Index (OVI) asks how much value should be added based on the component’s functional complexity. It provides a systematic way to defend (or challenge) costs by enabling procurement to reflect whether the price accurately reflects the component’s functionality.
Here is how we approach it:
- Six Dimensions of Functional Complexity
Each component is scored across six carefully defined dimensions:
– Geometric interaction
– Kinematic interaction
– Energy transfer
– Information interaction
– Tribological interaction
– Environmental interaction - Expert-Based, Structured Evaluation
Each dimension is evaluated using a fuzzy logic approach. Rather than using a binary yes/no evaluation, we rate each dimension by proportional scoring between 0 and 100%. This method provides a more accurate picture of the component based on clear definitions and visual guides.
For example, a simple flange gets a low geometric score, whereas cast housing with intersecting curves scores higher. - Weighted Aggregation
The six dimension scores are aggregated to form the OVI. This value reflects the justified “need” for value-add based on functional demand.

What makes the OVI work is the use of fuzzy logic. Components aren’t simply rated as “complex” or “not complex”. Instead, they receive nuanced scores across all six dimensions based on overlapping shape classes, environmental loads, and system roles. This allows for proportional scoring and more meaningful cost justification.
Case Study: When a Shaft Costs Too Much
A European defense contractor is sourcing a flanged shaft for 98,000 € per unit. To get a clearer picture, we ran the numbers with the team using the ACOP Matrix. The first step was to calculate the raw material cost. It came in at about 8,000 €. That means that 90,000 € were added beyond the raw material – an Actual Value-Add Ratio of 11.
To assess functional complexity, the team scored the shaft across the six defined OVI criteria. The results are shown in the following table:
| Dimensions | Assessments |
|---|---|
| Kinematic interaction | Low – no moving parts |
| Geometric complexity | Moderate – basic rotational features |
| Energy transfer | None |
| Information interaction | None |
| Tribological interaction | Moderate to partially high – continuous friction |
| Environmental interaction | Moderate to partially high – exposure to multiple minor to major stressors |
Taken together, these findings painted a clear picture of the cost optimization potential: the component was functionally not very demanding, especially considering its high price. Overall, the part scored low to moderate in most areas. Compared to other components, the flanged shaft was categorized as “Inefficient in Design, Process, or Sourcing”.
The team had strong grounds to challenge the design and re-source the part with tighter specifications. New supplier quotes came in at 54,000 €. This represents a cost reduction of 45% for the same part with refined specifications.
Thinking Differently About Cost
Used right, the ACOP Matrix does even more than identifying cost optimization potential by flagging overpriced parts. It also transforms how teams think about cost justification:
- Strategic Targeting: Focusing design-to-cost initiatives on the right components, not the loudest cost centers.
- Supplier Conversations: Shifting negotiations from gut-feel to quantified arguments.
- Internal Alignment: Bridging the gap between engineering ambition and commercial reality.
Why This Matters Now
As the supply chain evolves, complexity won’t go away. But inefficiency can. The ACOP Matrix helps teams make more grounded and defensible decisions, even when complexity gets in the way, by clarifying which costs are earned. Especially in high-stakes industries where cost structures can make or break strategic advantages, that clarity is priceless.
Want to take a closer look at your own components?
Source:
1EHRLENSPIEL, K.; KIEWERT, A.; LINDEMANN, U.; MÖRTL, M.: Kostengünstig Entwickeln und Konstruieren. Springer Berlin Heidelberg, Berlin, Heidelberg 2020.